 Hi, I'm Peter Rose, Founder of Longwood Currency Trading, and welcome to LCT Blog Post 07/01/20 — Price Mechanics of a FOREX Currency Pair.
Price mechanics of a currency pair describes what causes a pair to move from the mechanical aspect as opposed to the economic.
A currency pair, such as EUR/USD (the Euro against the U.S. Dollar) is a ratio of the value of 1 EUR to the USD. Let's say that this EUR/USD value is 1.0500. This means that 1 EUR will buy 1.0500 Dollars, and that means that the Dollar is weaker against the Euro by five cents.
We're only used to looking at the hundreds place, i.e. that .05 cents. But in currency trading, moving from 1.05 to 1.06 is an enormous move. Currency traders generally talk in terms of pips with 1 pip being equal to just .0001, one-ten-thousandth of a cent.
That seems pretty small, but that 1 pip move equates to $10 for the trader. So, the move from 1.0500 to 1.0600 is 100 pips and is a $1,000 move for the trader (on what's called a 'full lot' position; $3,000 if trading 3 full lots, for example, as it's all about scale).
To give you a sense for this sort of thing, a currency price may move 100 pips or so a day. But keep in mind that 100 pip move doesn't necessarily mean 100 pips up from the start of the day to the end of the day.
Sometimes it does, but more often than not, price will move all over the place for a total range of 100 pips but it might only close up 10 or 20 pips for the day, a $100 to $200 move.
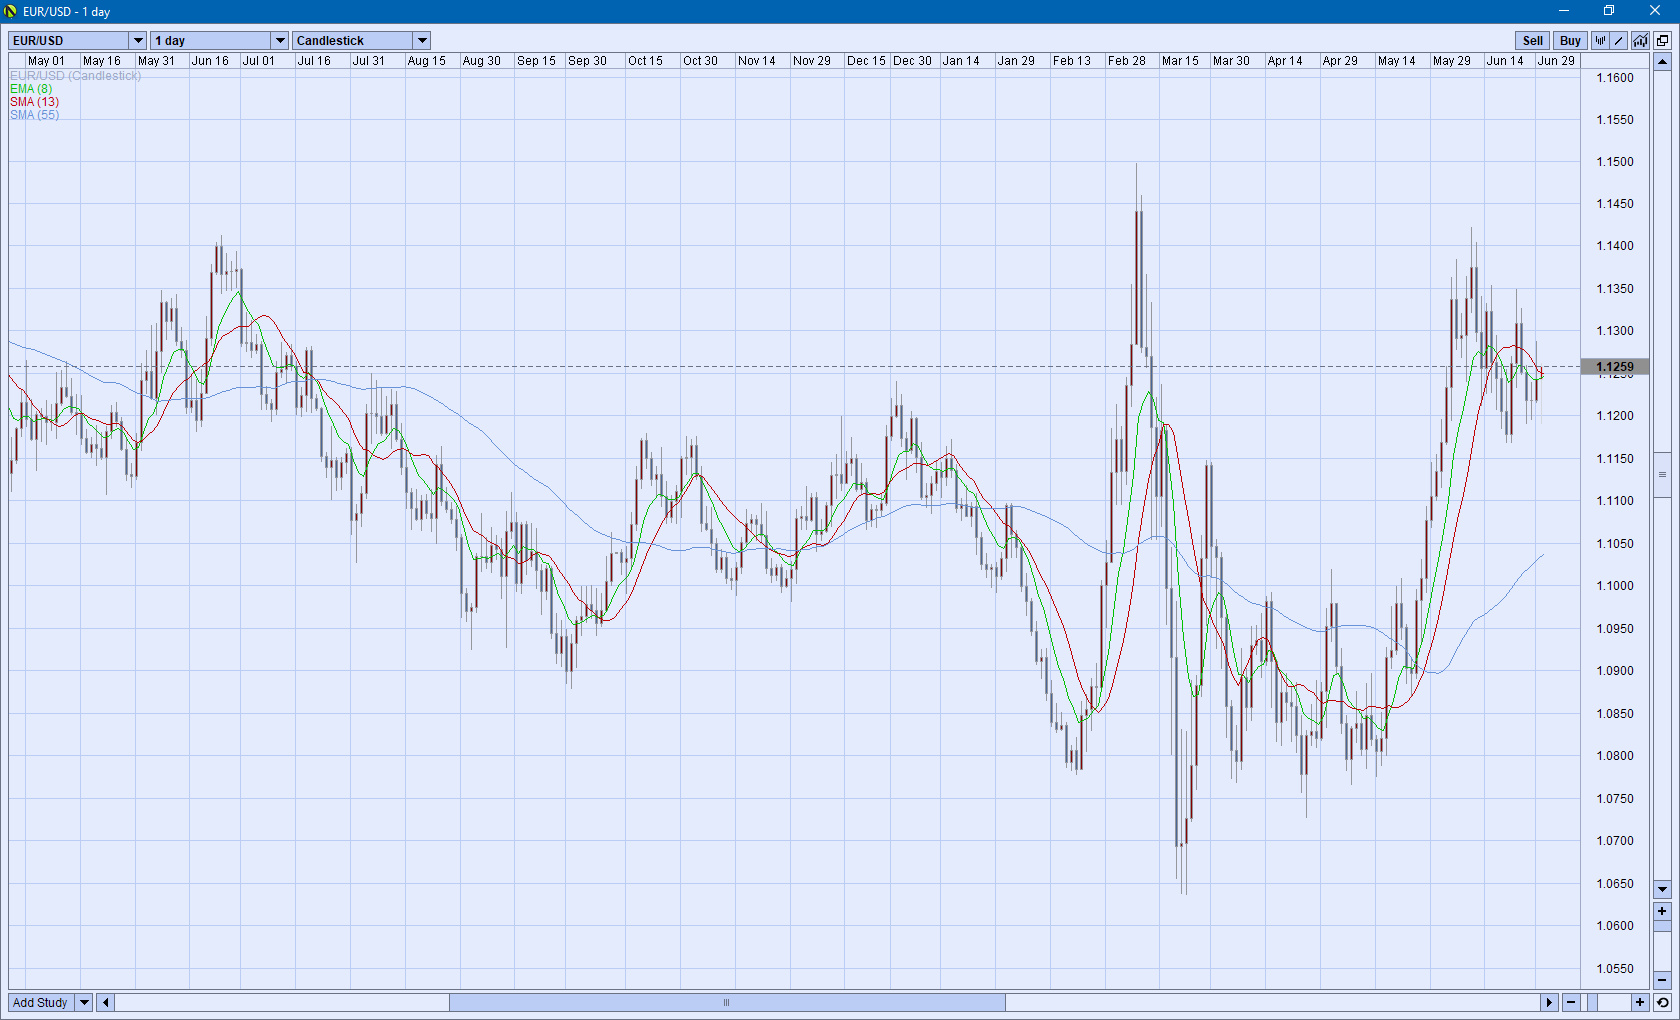
Let's take a look at some comparative charts of the same currency pair on different time frames.
The caption under each graph gives the currency pair, and the date the screen shot was taken; in this case we're looking only at EUR/USD on 06/30/20.
The next series of data represents the time frame of the chart, the ATR, and the number of pips between each horizontal line on the chart.
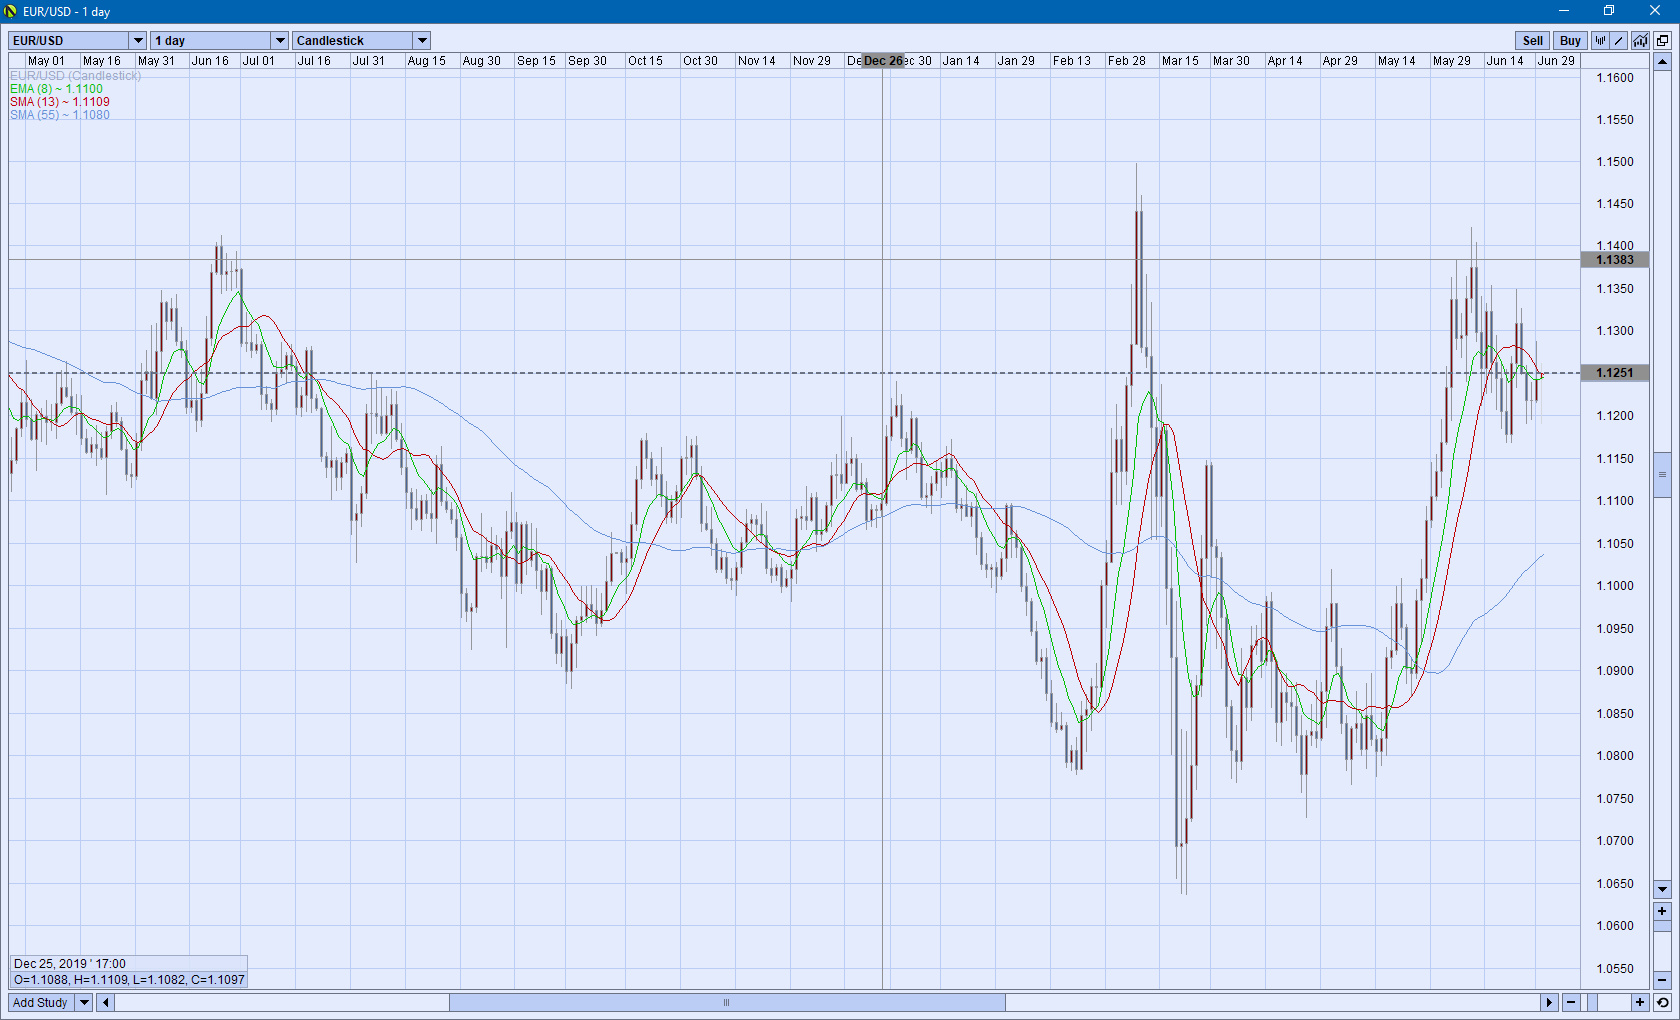
EURUSD-20200630-1day-ATR88-haxis50pips
EURUSD-20200630-1hour-ATR19-haxis10pips
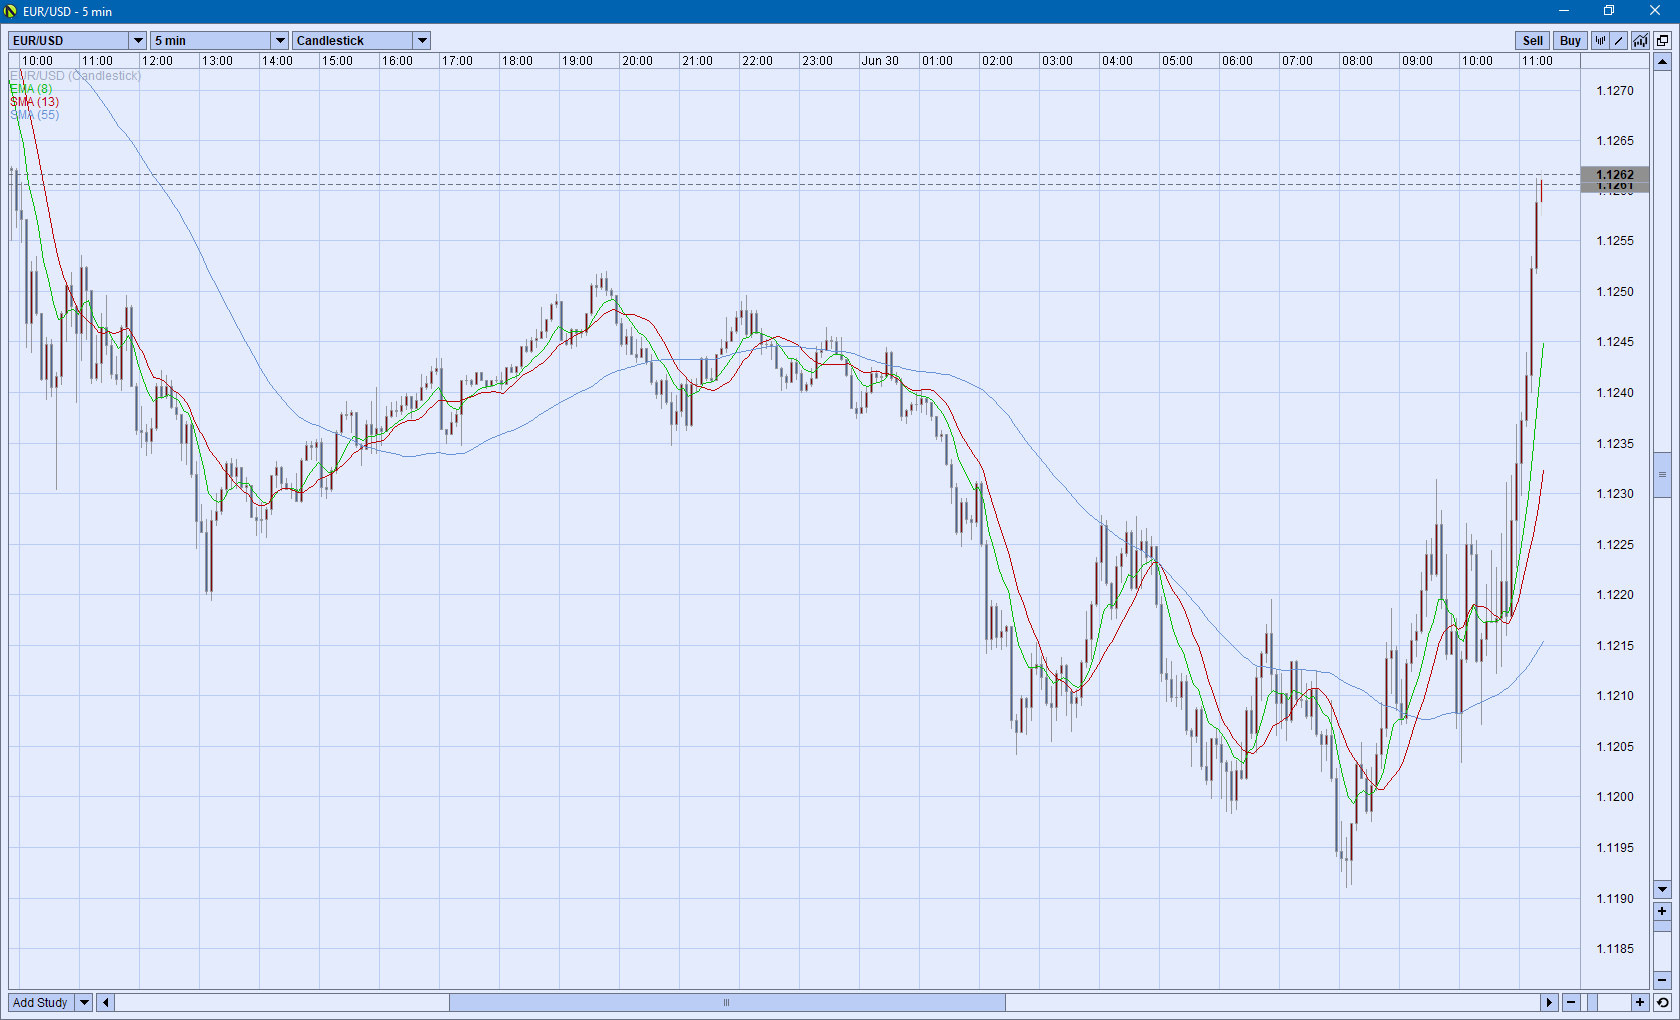
EURUSD-20200630-5min-ATR9-haxis5pips
It's difficult to jump back and forth between discussion and the charts, so let me summarize the data I'll be comparing:
The ATR (Average True Range) is the most telling statistic. Of note is that if I had left the ATR on the graphs, all would show greatly smaller values further to the left of the chart. That's because of the huge price swings further to the right.
This reveals a couple of very interesting price movement analysis points: ATR is radically different on different time frames, and candle price movement is distorted from time frame to time frame.
Well, that's obvious. So, why bring it up?
Look at the following picture I just snapped in my library:

Coffee mug height vs plant height
Doesn't the coffee mug look just about the same height as the fern on the window sill? In reality, the coffee mug is only 4 inches high, whereas the fern is 26 inches.
So? What's the point? That's obvious....
Sure it is, because that's part of our human daily experience to recognize what's going on.
This is a very simple, but similar, situation to Einstein's inordinately complex set of Field Equations in his Theory of General Relativity where it's time that's relative to an observer based on their view of an event.
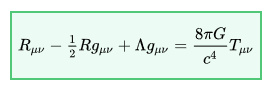
Einstein's Field Equations
Yeah, I know: that's a mess....
Doesn't matter because the point of all of this is that where any observation of an event takes place determines how the observer interprets the information.
And that's obvious, as well, isn't it?
Yes it is. However, as Sherlock Holmes cautioned: "Never theorize before you have data. Invariably you end up twisting facts to suit theories instead of theories to suit facts."
Great. But what if your data is skewed based on your point of observation? Then what?
Well, that's one of the main problems we, as traders, have when analyzing currency price action based on the evaluation of the underlying price mechanics on different time frames.
For example, a 30 pip move on a 5 minute chart with an ATR of 9 pips paints a totally different impression on the trader than looking at that same 30 pip price action on a daily chart with an ATR of 88 pips.
And yet, we all use some form of multiple time frame analysis regardless of if you're speculating, as I do, or if you're trading off of the daily charts.
Each differential in observational data creates an emotional response. If we're out 30 pips on the daily chart, we just go get another cup of coffee and wait it out. However, if we're out 30 pips on the 5 minute chart our stress level is going to be through the roof; our feeling is probably more like that Armageddon is neigh....
Thanks for taking your time to read this post,
Peter
p.s. For more of my thoughts on trading in the FOREX foreign currency market, check out my YouTube channel for Longwood Currency Trading