 Hi, I'm Peter Rose, Founder of Longwood Currency Trading, and welcome to LCT Blog Post 02/16/21 — Importance Of The Win To Loss Ratio Trading FOREX.
Of the 2 basic trading metrics — Reward To Risk, and Win To Loss — I feel the Win To Loss ratio is the least discussed, and appreciated.
Looking At Reward To RiskI personally disregard Reward To Risk as little more than a platitude espoused by those who really don’t understand trade entry theory.
The danger here is blindly leaning on this ratio, and not considering the utility of using the statistical Law of Large Numbers for evaluating the elements in their trading plan for developing their position entry and management methodologies.
Taking the discussion of Win To Loss out of the context of trading plan construction is good in that it brings to focus exactly what the ratio really represents. Doing so, however, comes with its own problems as someone not dedicated to continuing their research in this area can easily lose sight of the big picture.
Please consider this as you go through this analysis which is abstracted out of the overall context of market analysis.
The crux of my rather blatant statement at the start of this post that — "I personally disregard Reward To Risk as little more than a platitude espoused by those who really don’t understand trade entry theory" rests in the simple fact that you can have a reward to risk ratio of 10 to 1, but if you lose 8 times and win just twice you're still badly underwater.
You could argue that considering both reward to risk with that of win to loss is essential "best practices". But I would counter that with a question: "What is reward to risk analysis based on?" It's to insure that when you win, you win more in aggregate than the losses that proceed the win.
But that's just how you view reward to risk; it doesn't require reward to risk to be a part of the trade analysis. And that's why I don't use it.
Looking At Win To Loss
First, it's going to take a serious trader a long time to determine what their win to loss ratio is; at least 100 trades. At least...
In addition to time, and the number of trades necessary to develop a significant sample size of data to calculate a viable win to loss ratio is the issue of the trader's own trading ability changing over time, their results varying due to switching trading systems, and/or implementing different position management techniques.
Our frustration is that there appear to be so many moving parts to this understanding of what our personal win to loss expectation is. And there are a lot of moving parts to this. But, what's the key issue of the win to loss ratio? Isn't its purpose to give us confidence that, over the long run, we can "expect" a certain per trade outcome?
Sure it is! Look, if we know that over a long period of time we'll come out averaging, say, 5 pips over every trade taken, then we can have confidence in the system of trading we have outlined in our trading plan. Very cool....
Doing something many, many times uses the mathematics of The Law of Large Numbers. This enables you to average your performance out of a lot of data points.
I learned this in the financial product sales world. The key aspect in marketing, i.e. the process of finding customers to which you could make your pitch, is to expose your idea or product to as many people as possible.
That's the experiential math behind it, and is humorously referred to in marketing and sales as "dialing for dollars." How cute....
We've all been on the other end of that phone getting hit with exactly that. We hang up on the caller, but they don't care because: Every call they make is worth $5 to them ($200 / 40 calls = $5 per call).
So, the take-away here is that gaining this type of confidence in trading only comes with trading a lot. The more trades that you make, the more data you will have to calculate a viable win to loss ratio.
Specific Win To Loss Ratio TargetingBut just sitting at your desk pushing bid/ask as many times as you can doesn't resolve the issue of the necessary component of any quest: that of having a specific goal or problem that you are trying to achieve a solution for.
So, ask yourself this: What is the problem that the win to loss ratio solves?
For the sake of argument, let's say that you want to average just 5 pips profit over all of your trades. Some trades make make 50 pips, and some trades may lose 50, but averaged out each trade will be worth 5 pips. That's your goal, the problem to solve.
This is exactly like the "dialing for dollars" example I gave above. In that example, if I want to make $1,000 per week, and each sale I make is worth $200, then I'm going to have to make 5 sales per week. If I have to make 40 calls to get 1 sale, I'll thus have to make 5 x 40, or 200 calls a week to earn $1,000.
What this example shows is how to get to $1,000 per week in sales.
Here's another example of how this works. Let's do what those of us who have taken chemistry in school have done: it's called dry labbing the problem.
That gives you an inverted solution path. And it sounds convoluted. But, trust me: the process works on many, many problems.
But this realy is the same type of process we can use to get to our trading win to loss ratio, i.e. how many pips can I expect to make on average per trade?
So, let's dry lab this thing!
The below equation is the basic representation of the win to loss ratio of wins divided by losses, i.e. W/L. Note that the ratio is set to equal 1. This simply means that wins equal losses.
Which translates into the following:
Instead of wins equaling losses, however, we really want a profit of x dollars won after, say, 10 trades.
It could be 100 trades, or a thousand. Doesn't matter.
I'm using a ten trade sample size not as the trading sample size, but only to create a statistical model based on 10 trades that could easily be transposed into whatever sample size of trades you want to do later. This is the theory part that your later 100 or 1000 trades will need to resolve to.
So, of the 4 listed variables in that equation of:
- NumberPipsWon
- AmountWon
- NumberPipsLost
- AmountLost
which one is it that we should solve the equation for?
Well, there's really only 2 of those variables we need to choose from:
- NumberPipsWon
- NumberPipsLost
The dollar amounts won or lost are not the key; only the pips. The amounts are something you'll plug into the equation per your trading plan goals. That's why they can be eliminated from the equation.
Now, you could have both number of pips values be variables, but then the math gets more involved. My goal since I began trading has been to reduce the issues (problems) down to the simplest components.
I believe in this because of not only my physics and math backgrounds, but also from the practical standpoint of my 33 year career as a senior software engineer doing the analysis, design, and coding of complex business software applications.
In my, as in my opinion: I simplify my trading process by simply establishing a set number of pips as my trade entry stop loss point.
Because I'm a day trader, I have short profit and risk targets. In all of my blog posts, and YouTube channel for Longwood Currency Trading I always refer to my using an 8 pip hard stop for every trade I make. This value, as well as my potential profit target level, are based on the characteristics of the currency pair I focus on as to ATR, price action, spread, etc.
If those characteristics should change, that 8 pip hard stop might have to change as well, but I'm going to use it here for demonstrative purposes of the scope of this post.
For purposes of this discussion, I'm going to use a $1,000 bank such that I trade 1 mini lot against. This simplifies calculations because a 1 pip move is worth $1.00. Thus, in my equations, I can simply eliminate both amount variables from consideration.
Ha! That just leaves the NumberPipsWon variable to solve for....
In addition, a key variable here that was not represented in the original equation is the ratio's expectation value. This was initially simply set to the value of 1 to establish that the neutral condition of win to loss is that wins equal losses. Expressed this way, the equation was presented as
Thus, that key variable had been set to 0. But what we want to know is how many overall pips will be won not only over the entire data set, but as, ultimately a per trade expectation value.
We're going to be dealing with ten trades in our sample analysis, so how many pips on that $1,000 bank would you want to end up with after 10 trades?
Stated another way: After making 10 trades, how many pips would you have to net to feel that the work necessary to make those trades was worth it? The equation should thus be expressed as follows:
If you trade using best practices of having $1,000 to trade 1 mini lot (or $10,000 to trade 1 full lot), then if you could just make 5 pip, or $5 per trade on that $1,000, and you made just 1 trade per week, that would mean that your expectation of year end profit would be $5 * 40weeks (arbitrary so you can vacation in the islands the rest of the time), and that would equal $200, or 20% return on your bank/risk. That's terrific, so let's shoot for that.
Thus, over the 10 trades in our sample run, making — on average — 5 pips per trade, we'd need TotalPipsWon for the 10 trades to be 50, and the equation is now:
Note that both wins and losses have been modified with a percentage value. Let's say that both WinPercent and LossPercent are each 50%, i.e. you'll win 50% of the time (5 times) and lose 50% of the time (5 times), and so the equation can be rewritten for this case as:
Since we also set the NumberPipsLost to a static value of 8 pips, the equation can now be set to:
Since we want to calculate the value of NumberPipsWon, a little algebra provides us with the solution equation:
Let me show you how this works. Because both WinPercent and LossPercent are based on 10 trades, then a WinPercent of 10% is equivalent to 1, 20% is 2, etc. That's another reason I just chose 10 trades. It makes it all so much simpler....
Thus, if you won 6 trades (60%), and lost 4 trades (40%) the equation would become:
And the value of NumberPipsWon becomes 13.67.
What does that mean?
This is verified in the basic equation we started with:
The value of 52 is due to upping the 13.67 to 14 pips, and is right at that 50 pip level as advertised.
Win To Loss AnalysisSo, here's the importance of understanding win to loss: based upon how many pips you want to achieve, on average, over your trading, what is a reasonable NumberPipsWon value for you to strive for?
If you're a long term trader then your profit targets might be, say, 100 pips and you might be setting your hard stop at 50 or 100 pips, whatever. However, if you're a short term trader like I am, then profit targets are around 25 pips out, and your stop can be anything you want it to be, from my 8 pips to maybe out to 20 pips.
You have to decide what those values in the equation should be, and then plug them in. Then put that equation into a spreadsheet where you alter the value of the WinPercent and use that WinPercent value to calculate the LossPercent.
If you want a 60/40 win to loss, for example as I just showed, then put in 6 for WinPercent. Program the spreadsheet to calculate the LossPercent to 40%, or 4 (i.e. 100% - 60% = 40%), and BOOM! You're all set.
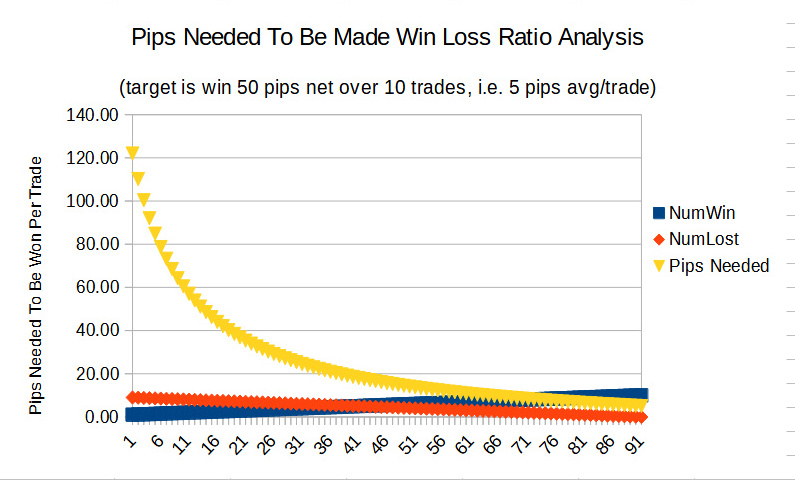
And this is exactly what I did, and show the results in the graphs below.
In fact, I did 3 simulations incrementing the WinPercent value by 1%, 0.5%, and 0.1%. What this means are WinPercents incremented as follows:
- 1, 2, 3, etc.
- 1, 1.5, 2, etc.
- 1, 1.1, 1.2, etc.
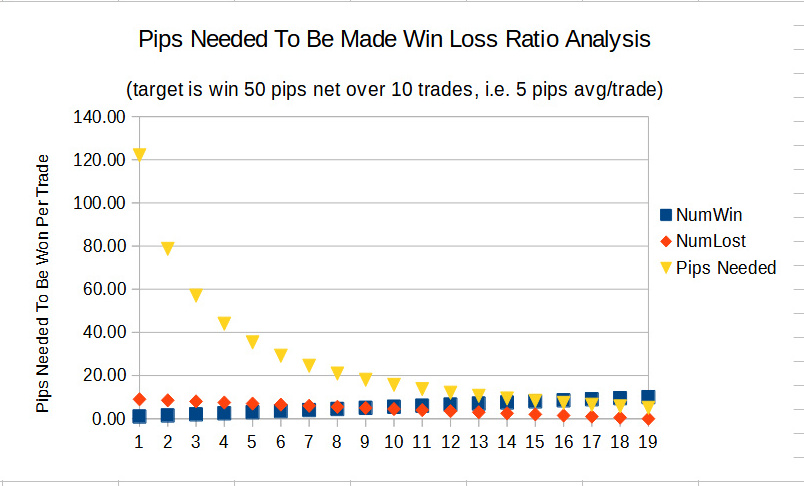
The reason was to compare the difference in NumberPipsWon at 60% with that of 60% to 65%, and 60% to 61%. I then created a line graph showing these results.
I did this because where the win and loss lines cross on the graphs at a point where not much change in the number of winning pips is necessary to get better results represents a solid win to loss ratio for trading under the assignment of values made to the other variables.
I used the 3 different increments in WinPercent to see if there was any difference in performance between one over the other, and this is obviously born out.
The long and short of all of this is that with a 30%, 3 trade win rate, you'll need to make 35.33 pips per winning trade, whereas with a 33%, 3.3 trade win rate, you'll need to make 31.39 pips, a significant difference of almost 4 pips (3.94) per trade less.
That's an 11% difference in profit over just a 3 pip change. Something that could make the difference between a successful career, and one not so successful.
And compare the need to make 35.33 pips with a 30% win rate as opposed to only needing to make 13.67 pips with a 60% win rate.
Now, how to go about changing your trading from a 30% win rate to that of a 60% win rate is beyond the scope of this analysis.
Though that's an absolutely stupidly obvious statement, the graphs of this analysis show that it's not necessary to become an 85% win trader requiring just 7.29 pips per winning trade, where it might be far easier to make a less strenuous win rate of 65% because of the ease you have of getting an average of just 12 pips per winning trade.
So, let's take a look at the spreadsheets and graphs.
Win Loss Ratio Analysis – Win Increment 10.0%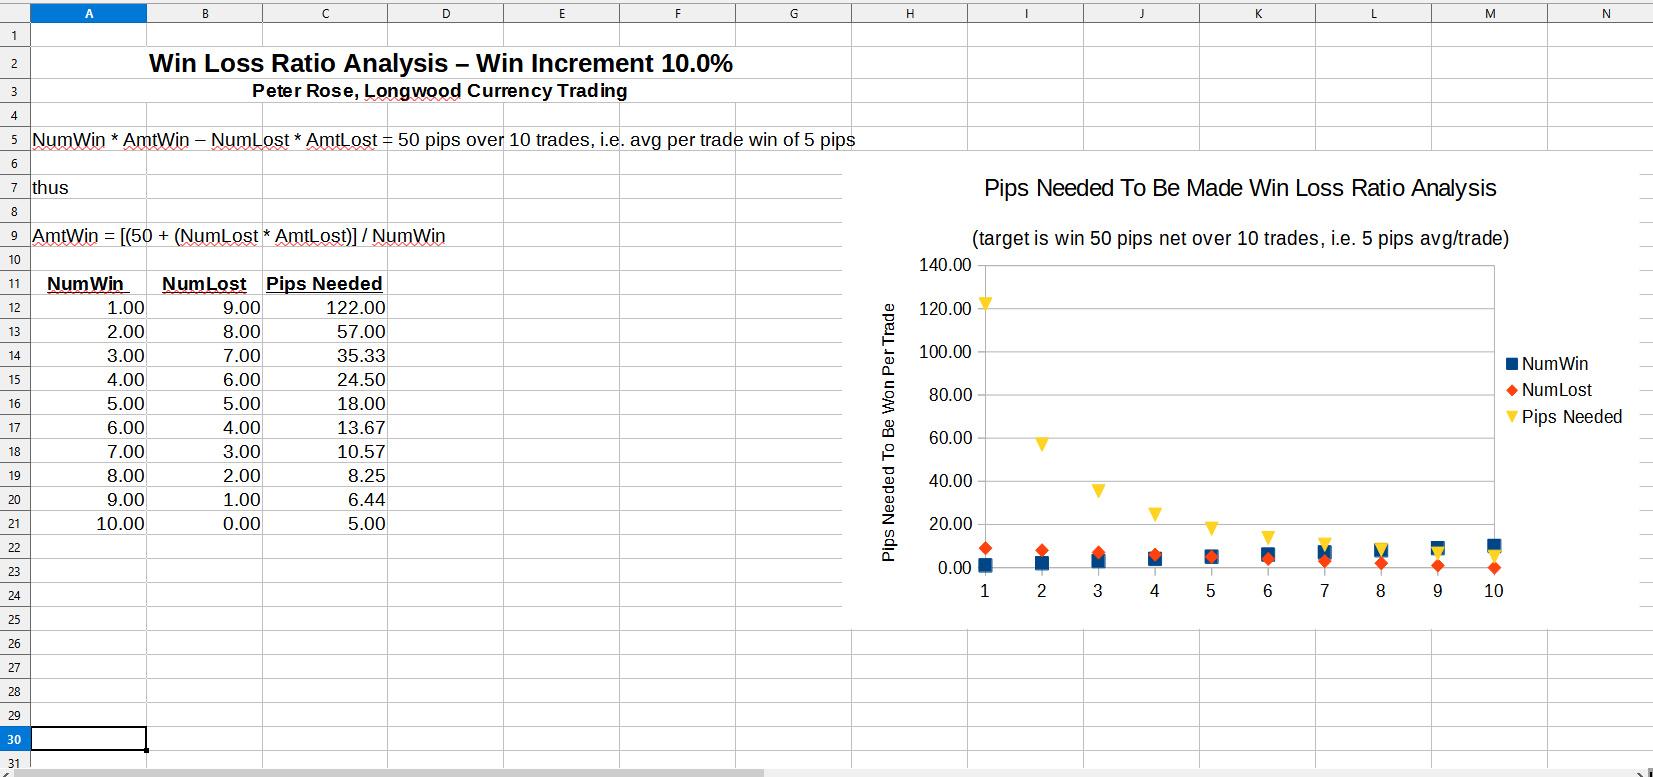
Win Increment 10.0%
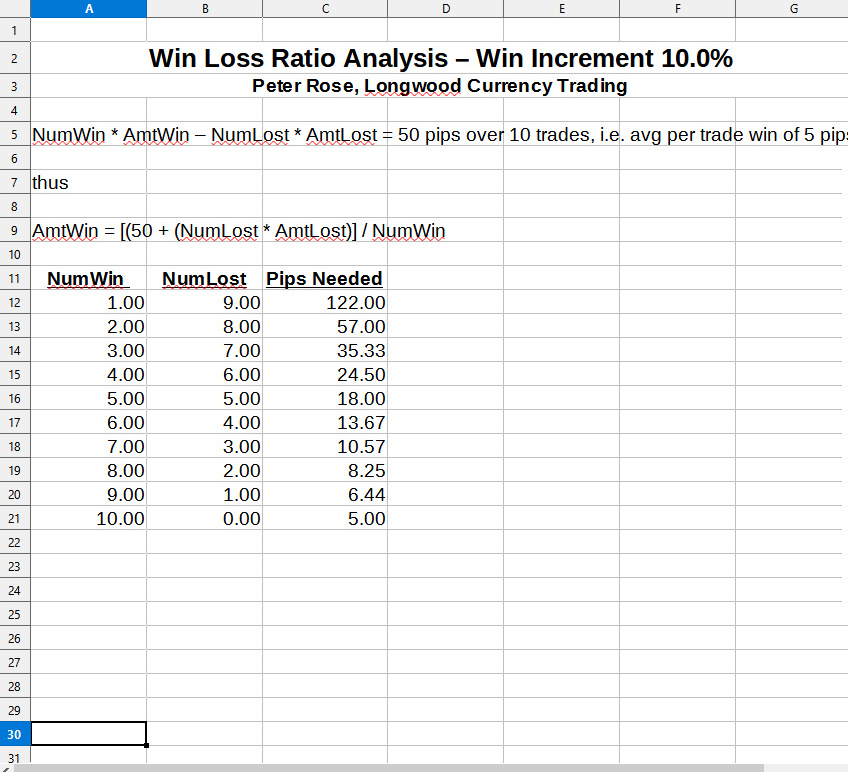
Win Increment 10.0%
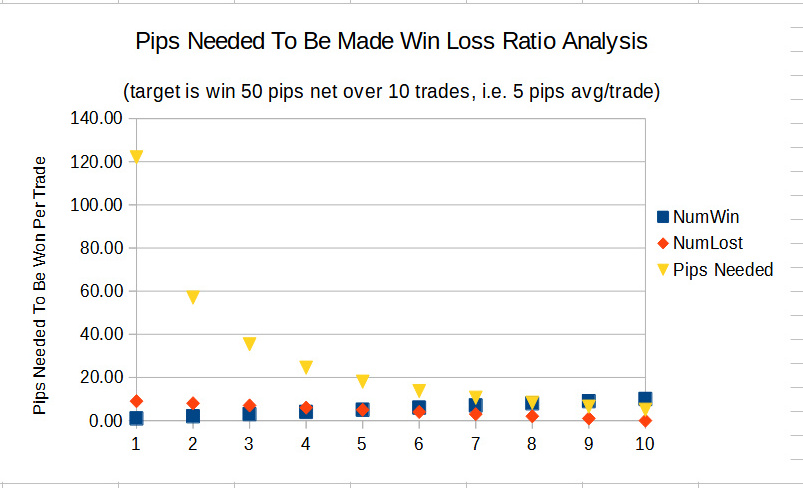
Win Increment 10.0%
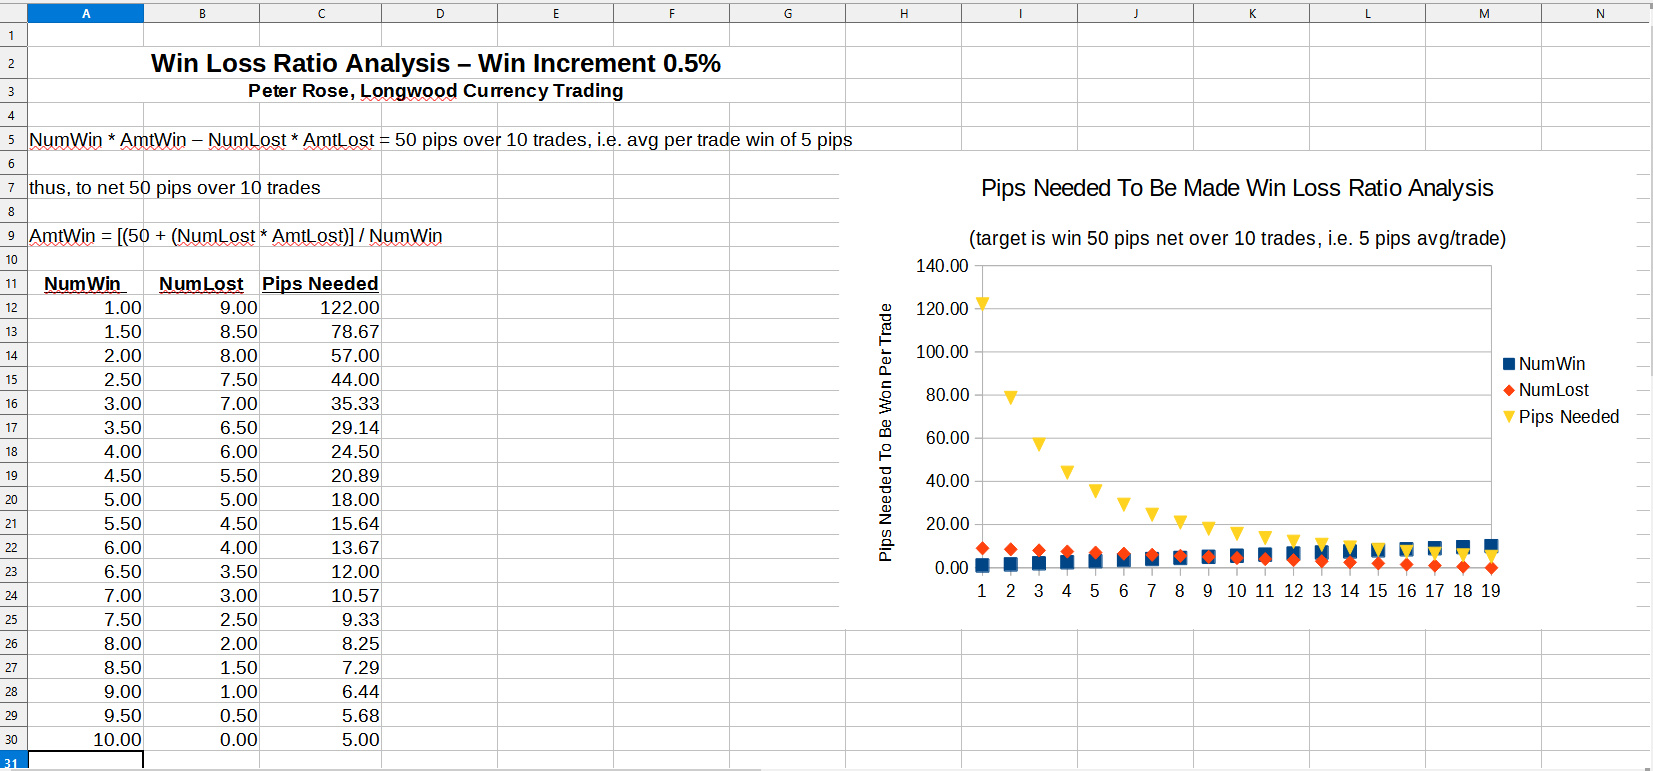
Win Increment 0.5%
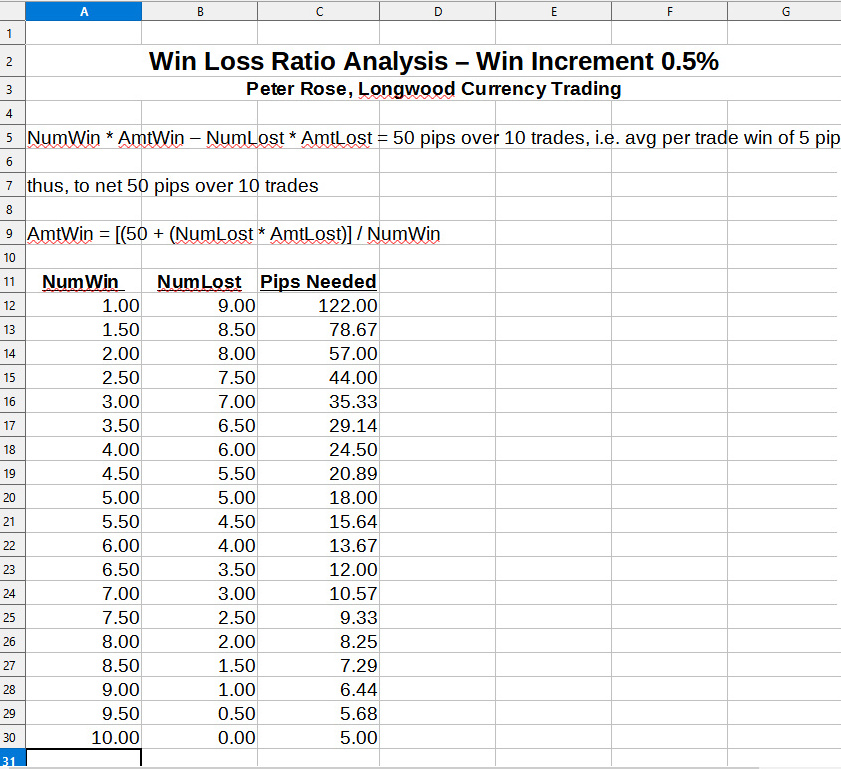
Win Increment 0.5%
Win Increment 0.5%
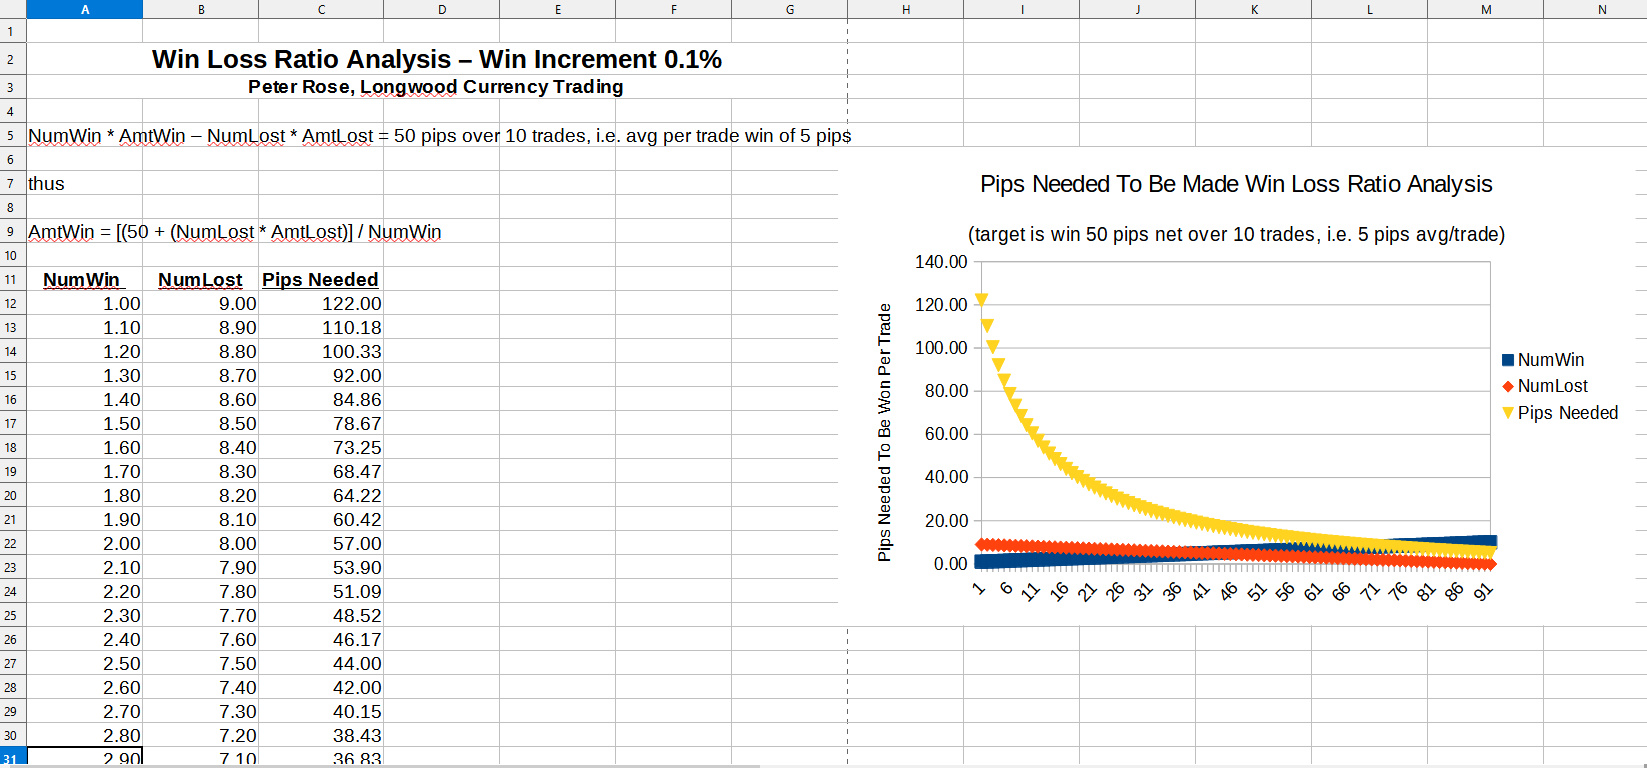
Win Increment 0.1%
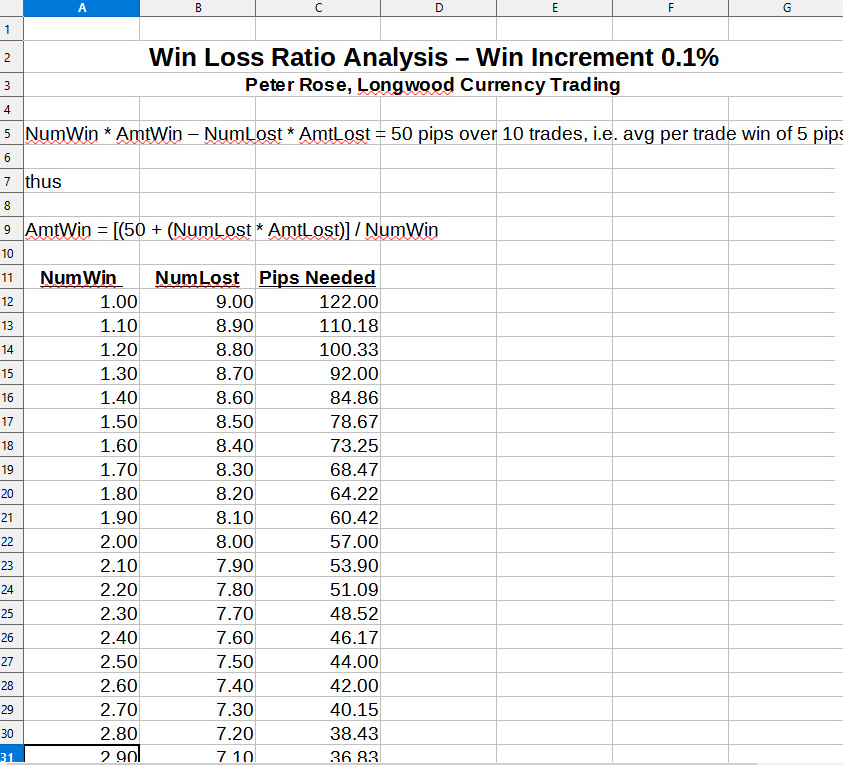
Win Increment 0.1%
Win Increment 0.1%
Though you might be disappointed in the number of trades you need to make in order to calculate a solid win to loss ratio of your trading, don't be.
When I started trading, I recorded each transaction, and did running balances of all the metrics, including win to loss. It's really interesting to see the difference in performance from say 20 data points to 50, etc.
That way, it makes it more like having a fine wine: you open it, and taste it right out of the bottle. It's a little sharp, so you sip it over a long period of time appreciating each phase of its transition.
Though that's an absolutely stupidly obvious statement, the graphs of this analysis show that it's not necessary to become an 85% win trader requiring just 7.29 pips per winning trade, where it might be far easier to make a less strenuous win rate of 65% because of the ease you have of getting an average of just 12 pips per winning trade.
Companion VideoHere's that companion video of the same title: A Different View Of The Win To Loss Ratio I mentioned at the start of this post that puts all of this together from a different view point.
Thanks for taking your time to read this post,
Peter
p.s. For more of my thoughts on trading in the FOREX foreign currency market, check out my YouTube channel for Longwood Currency Trading